
Bitcoin (BTC) and Ether (ETH) are finally correcting after more than a month of bullish rally. A healthy correction to better break their range or is it still the beginning of a strong fall? The point in the analysis of the week
Bitcoin (BTC) rejected on the top of its range
As mentioned in our previous technical analysis, the price of Bitcoin (BTC) has finally hit its range top around $24,300. Now, with the news not conducive to a continuation of the rise in the short term with the SEC threatening cryptocurrencies in the United States, cryptocurrencies are correcting and going back down.
It must be said that this fall was expected by many investors within a crypto market, which will have taken off in a straight line for more than a month, leaving the hope of buying Bitcoin under 15,000 dollars thinning. The current correction is therefore an opportunity for some to enter in increments after a +11% drop in a week.
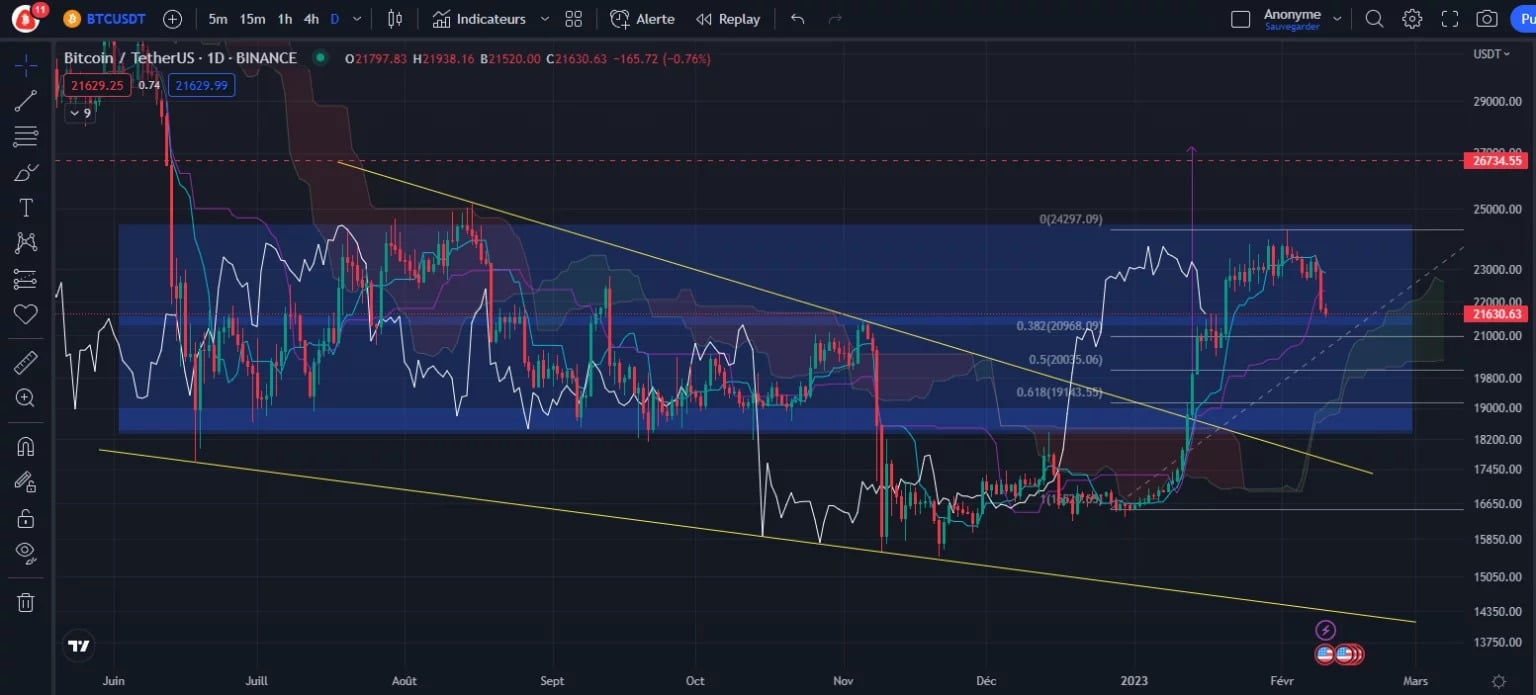
Figure 1 – Bitcoin Daily Price Chart
So is this the end of this bullish rally in cryptocurrencies? It would seem not. Indeed the target determined by the chartist pattern in yellow (Descending Bevel) is still around $26,735 (height of the triangle at its entry, carried over to the location of its breakout) and will remain active as long as the price remains above the bottom of the range at $19,000.
In general, this type of pattern gives the price a good chance of hitting its target. In theory it seems quite logical that Bitcoin will manage to bounce off the key areas determined by the Fibonacci retracement above. BTC should continue to fall towards the 0.5 Fibo at $20,000 or even the 0.618 at $19,145. These levels are indeed the most regularly revisited during corrections and are therefore to be preferred.
As long as the price bounces off one of these levels, then this correction will remain healthy and will most likely allow BTC to move back up towards the $26,735 target, as the price remains supported by the cloud and numerous supports. On the other hand, if it breaks back below the 0.618 Fibonacci, then there will be a risk of breaking the range again from below as there will be a strong chance of a 100% retracement of the January rise towards $16,600.
Ether (ETH) follows Bitcoin and plunges
The same is true of Ether (ETH), where the price has been falling for several days. It seems to be heading towards the middle of the range, which must be kept as support in order to hope to break this large rectangle from above with the target at $2,608 determined by the yellow triangle. The mid-range zone having served as resistance several times before, it would be quite logical that it now acts as support to allow the price to bounce back.
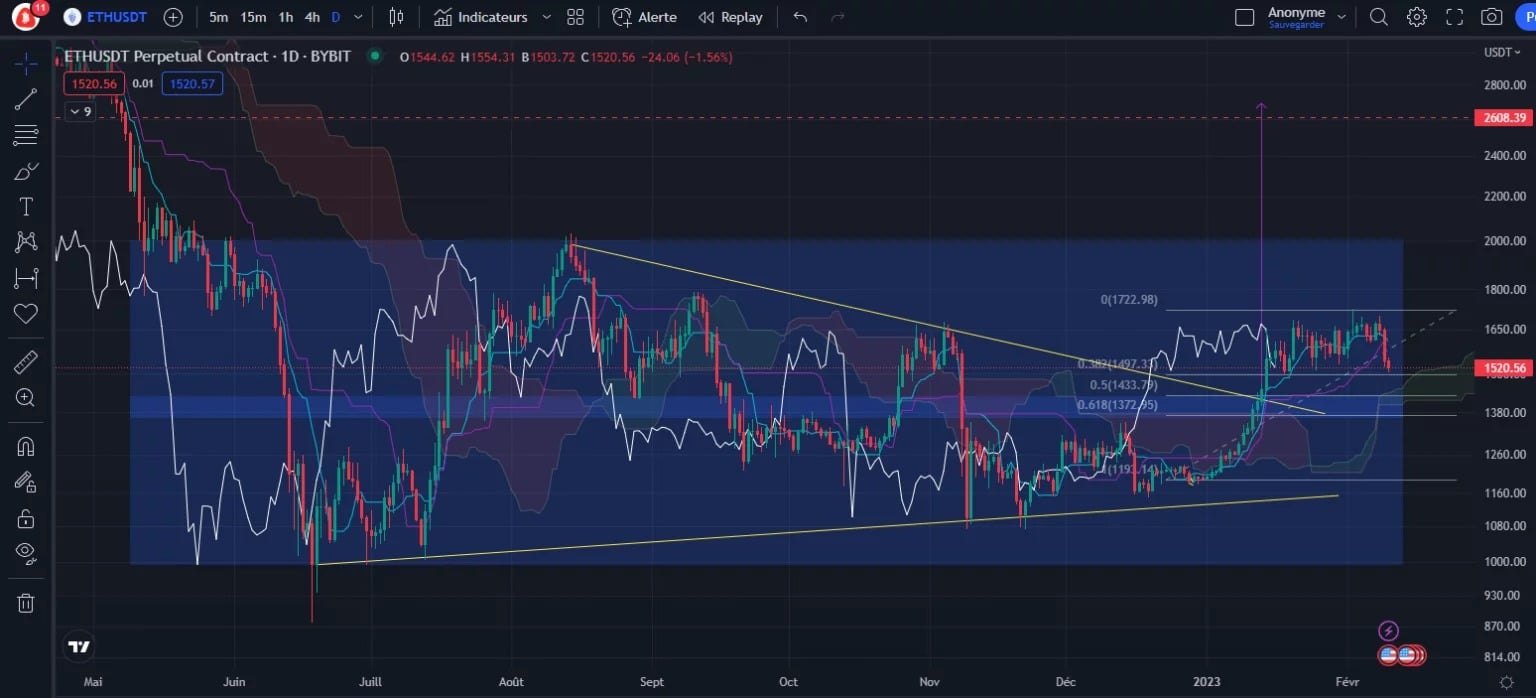
Figure 2 – Ether Price Chart (Daily)
Levels that the price could build on are $1,433 (0.5 Fibo) or even $1,372 (0.618). If these levels do not allow the price to break out again, then they will become resistance and lead to a 100% retracement of the January rise with a very likely return of the price to $1,200.
The next few days will therefore be decisive for Ether as well, as it will need to find enough liquidity to bounce back and manage to break its $2,000 range and resistance from above.
Conclusion of this technical analysis
Bitcoin and Ether still fail to break their ranges from above. The ongoing correction is an important test of whether the crypto-currencies can break out of their range safely, or whether they will need to correct further in the coming weeks to recover enough liquidity.