
Still within their range, Bitcoin (BTC) and Ether (ETH) are showing new compressions that could well trigger big moves soon. Will cryptocurrencies finally take a clear direction
Bitcoin still in range
Nothing has really changed since our last cryptocurrency analysis, the price of Bitcoin (BTC) is still moving in its long-standing daily range with a broadly bearish bias on the higher time units.
Bitcoin is still unable to break out of this bearish trend marked by lower and lower market tops and the cloud and the Kijun are not letting any attempt at a structural reversal pass.
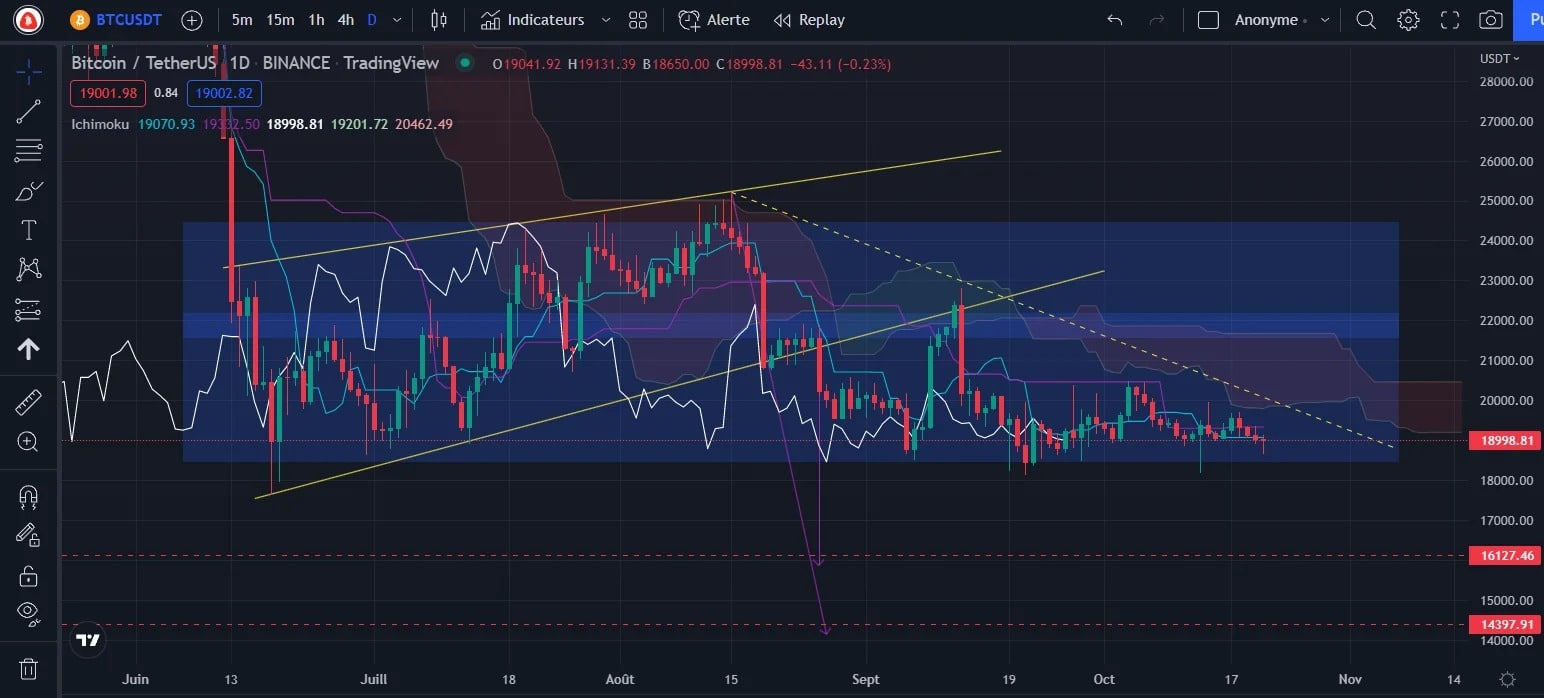
Figure 1: Bitcoin Daily Price Chart
It is for all these reasons, as well as a still difficult economic environment, that we will continue to favour rather bearish setups on the cryptocurrency charts for the time being.
With Bitcoin having broken an Ascending Beam and Bear Flag to the downside, it seems destined to go for much lower targets at $14,200 and then $14,400.
Only a return of the price above the Daily Cloud at $22,000 could allow for a short term reversal of the trend with ambitions to break out higher.
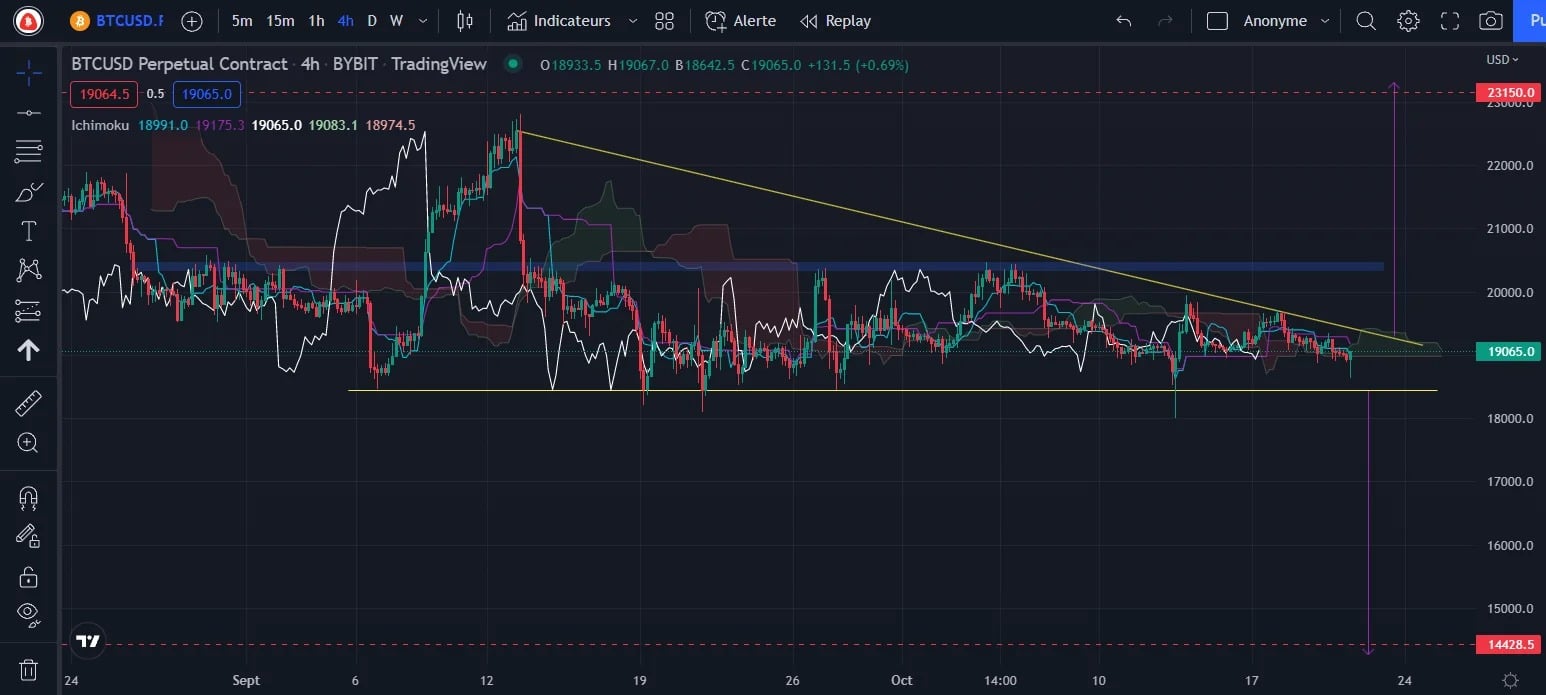
Figure 2: Bitcoin price chart h4
At the moment, the H4 chart shows us a triangle that takes into account both lower and lower releases on its upper part, and higher and higher releases on its lower part. So here we have a symmetrical triangle, which breaks more generally in the direction of the trend that precedes it. Here, the trend is clearly bearish, so the objective of breaking this triangle should most likely take us towards $14,400 in the coming days or weeks.
However, probabilities are not certainties, so we should be prepared for a potential breakout from the top, which would cause the price to return above $23,000. What is certain is that the h4 cloud is currently resisting the price, which increases the risk of a further decline.
Join our group composed of Vincent Ganne and our fundamental and on-chain analysis experts on the Pain Grid. Our experts deliver daily exclusive information and analysis on the crypto market to optimize your knowledge!
Ether (ETH) is about to break a downward triangle
The price of Ethereum (ETH) is showing increasing compression within a continuation triangle. In theory, here too the odds are in the bearish breakout camp.
We will wait to see if the price manages to bounce off the cloud and break the upper trendline towards a target of $1,475, or if support gives way to a further fall towards $1,093 or even $760 (daily target following the break of an ascending wedge from below).
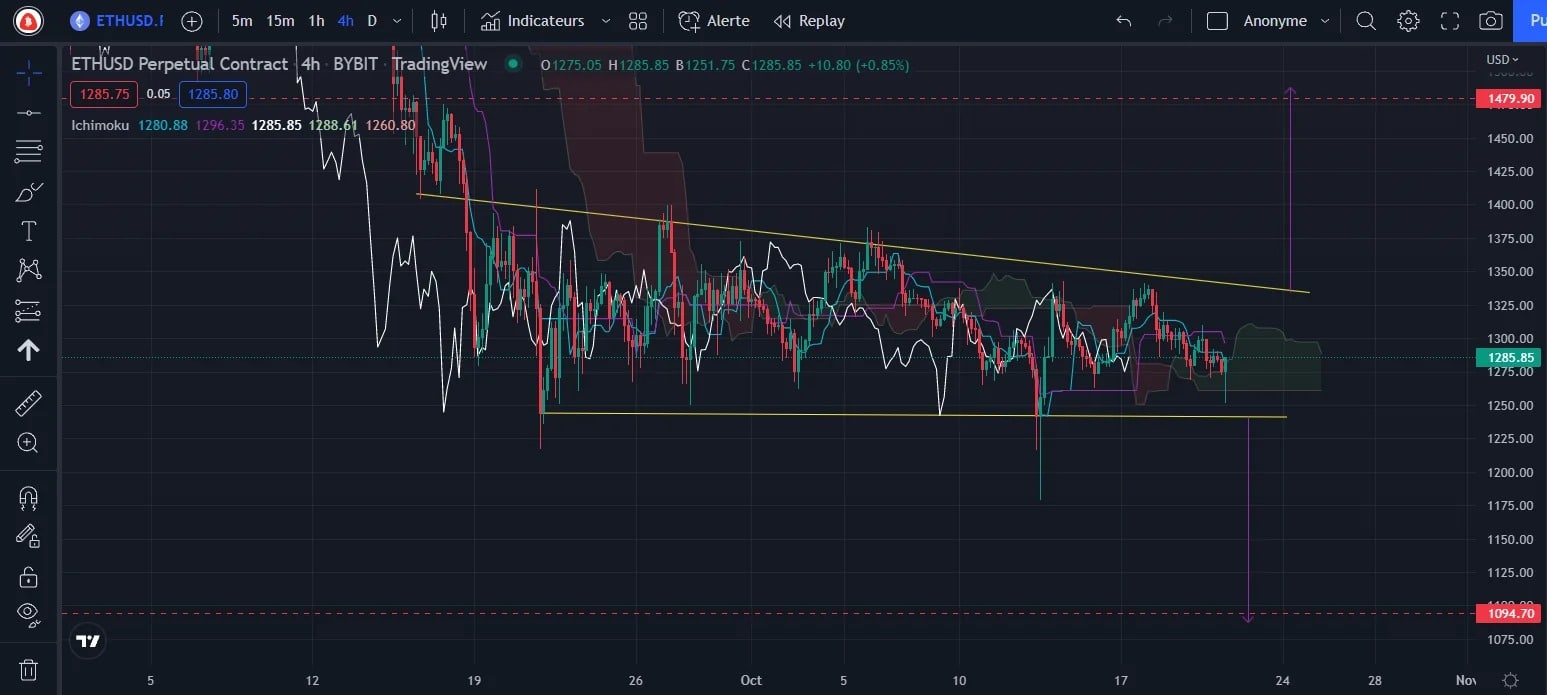
Figure 3: Ether price chart (h4)
To become bullish again, Ethereum will also need to show signs of a reversal, including a return of the price above its daily cloud at $1,600.
Conclusion of this technical analysis
Bitcoin and Ether are expected to break an H4 triangle soon, giving rise to another big volatile move.
While the odds are in favour of a further decline, waiting for confirmation of a breakout seems more appropriate in a market that has finally been in a range for many months