
Bitcoin (BTC) and Ether (ETH) have made bearish moves over the past weeks. However, they seem to be showing early signs of slowing down and a willingness to regain strength. A bullish recovery is a scenario that should not be overlooked. We take stock together to understand, and position ourselves accordingly.
Bitcoin (BTC) Technical Analysis
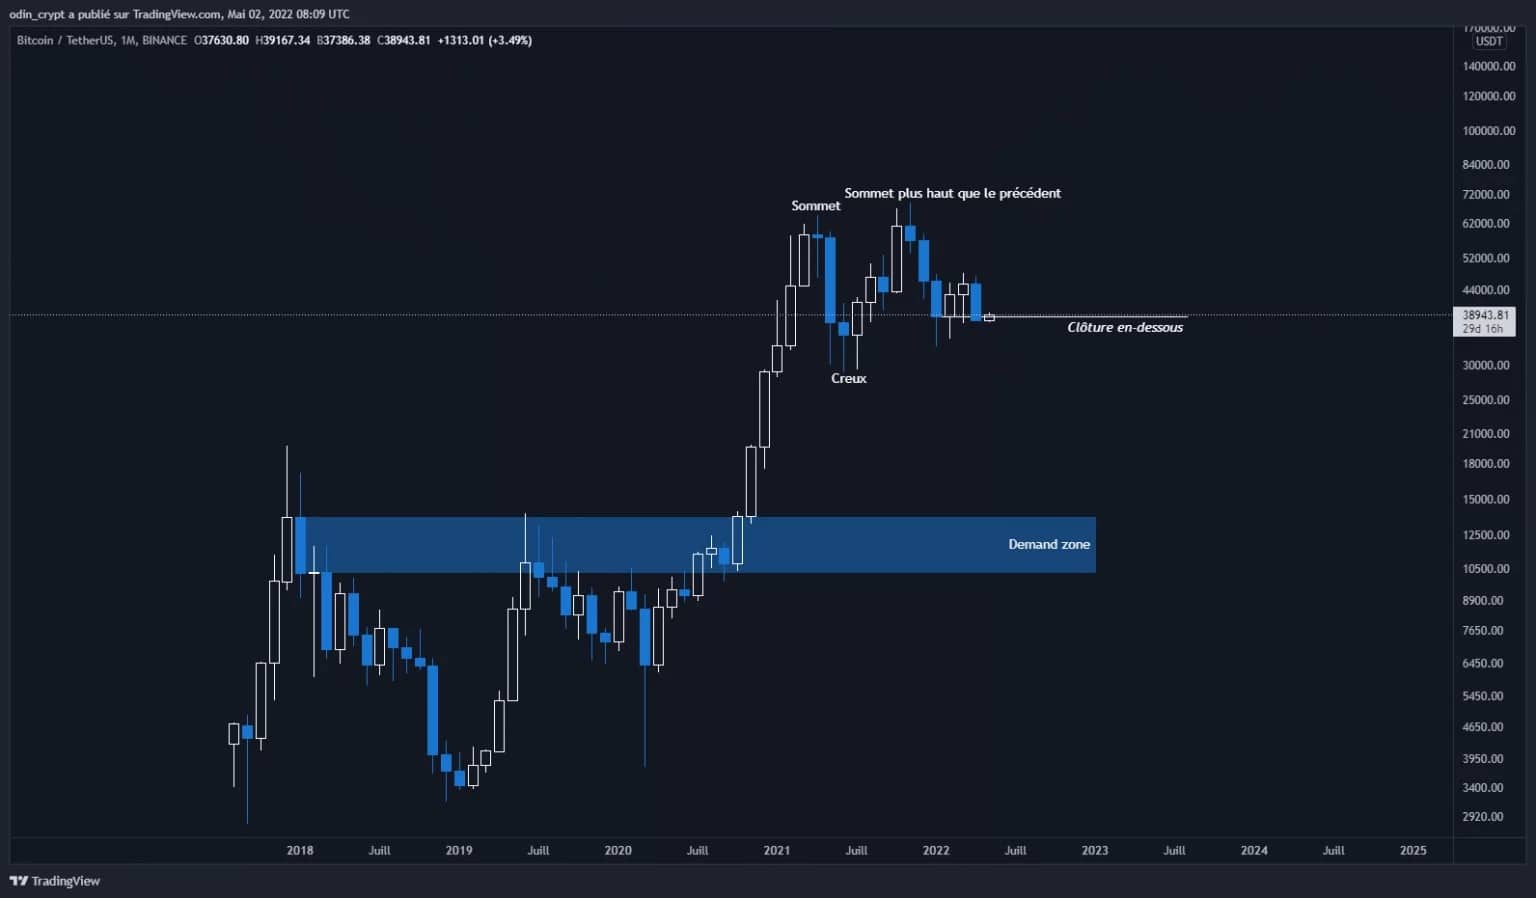
Let’s start our market update with an analysis of the Bitcoin (BTC) price on the monthly view. Indeed, this close was made last Saturday night. It is important to understand the macro situation in which the price is evolving.
The first thing to note is a sideways structure printing higher highs and lows than the previous ones. It is still too early to tell if the support that has been established is indeed the new low, so we will take the latter into consideration for now.
We can say that a close below $35,000 would lead us to revisit the untested demand areas. These areas are between $10,000 – $18,000, and correspond to the beginning of the bullish impulse, but also to the areas of the former broken highs.
As long as the last monthly low is not broken, the bullish logic is not questioned.
Bitcoin (BTC) analysis in 1M
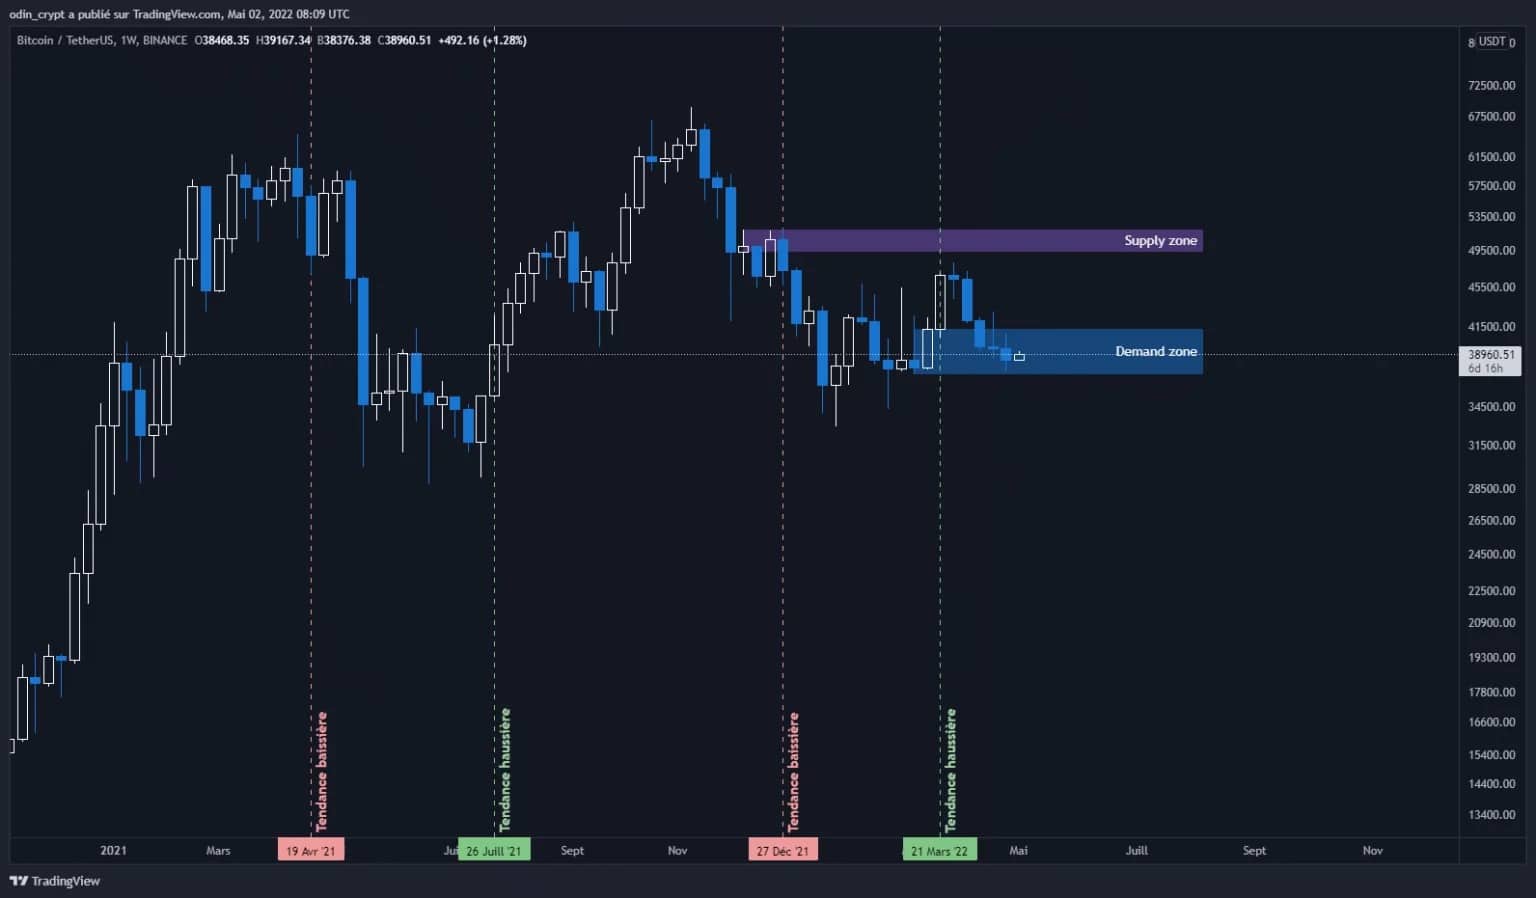
Let’s focus on the weekly view to refine our analysis. On this time unit, we notice that the Bitcoin price is experiencing a lateralization phase on its last major point of interest. The $33,000 – $34,000 level was used as a pivotal zone during the fall at the end of January 2022. Since then, the price has been wandering between $34,000 and $44,000.
So we are in a trendless phase. And this is why the price is forming complex structures that trap a large number of traders in the market. Liquidity is being recovered on both sides of the market.
On this time unit, I consider that as long as the price does not close below $31,000 a bounce is always possible.
Bitcoin (BTC) analysis in 1W
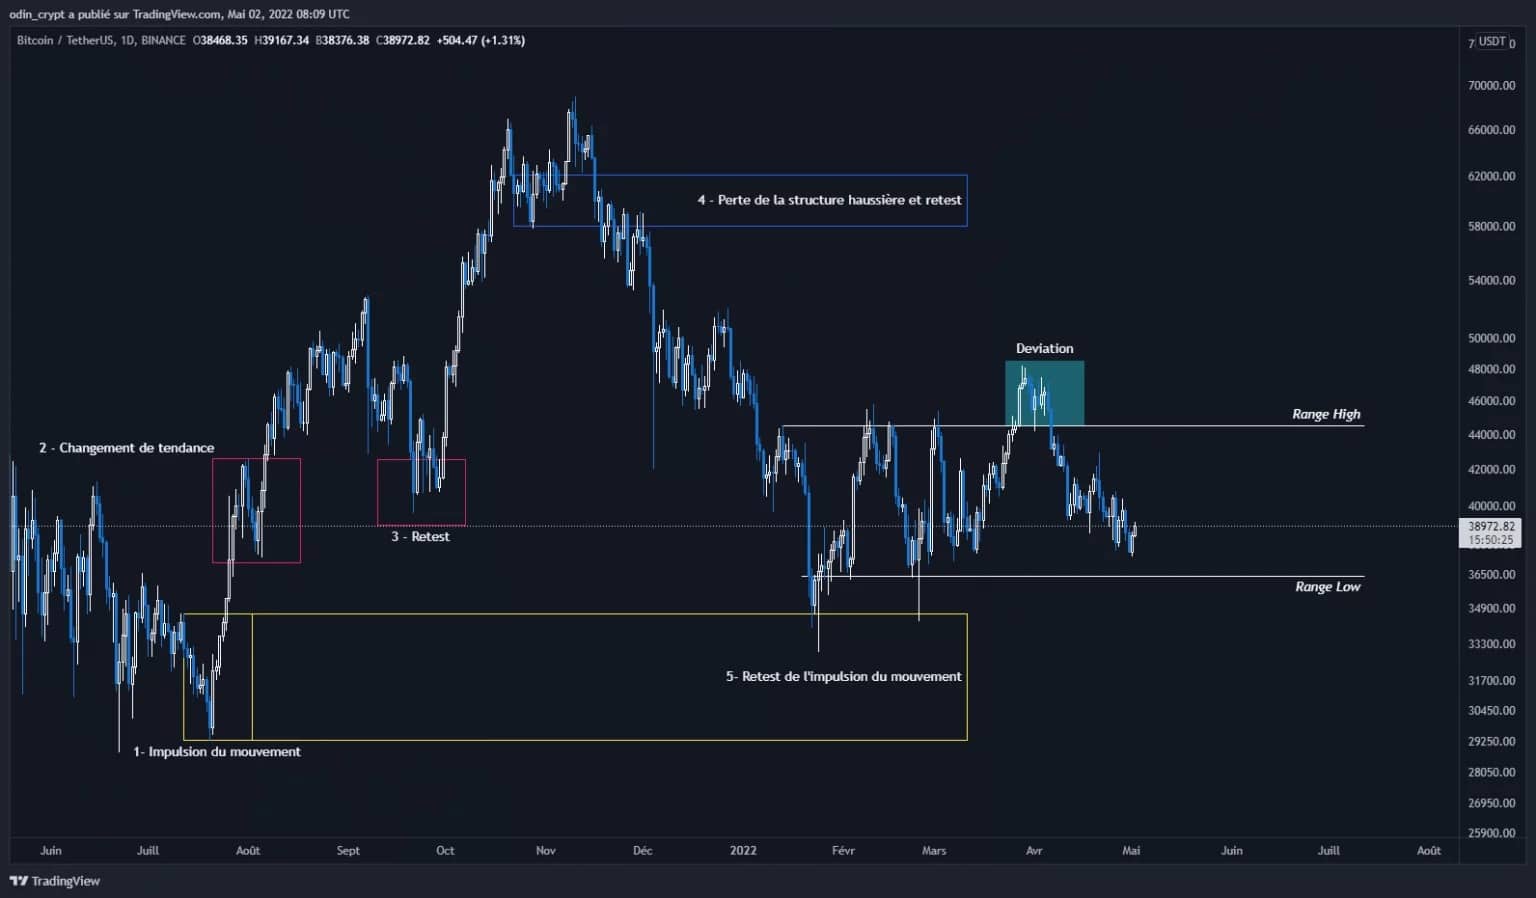
The daily view gives us details of the internal price movements. The range formation is clearly identifiable with a low bound at $36,500 and a high bound at $44,500. A bullish deviation has taken place at $48,500, and logic would dictate that the price revisits the opposite boundary.
As long as the price remains between these two boundaries, it will only offer opportunities for traders and those looking for short term positions. If you are not familiar with these practices, I suggest that you wait for a range resolution before building your future positions.
Bitcoin (BTC) analysis in 1D
Ether (ETH) technical analysis
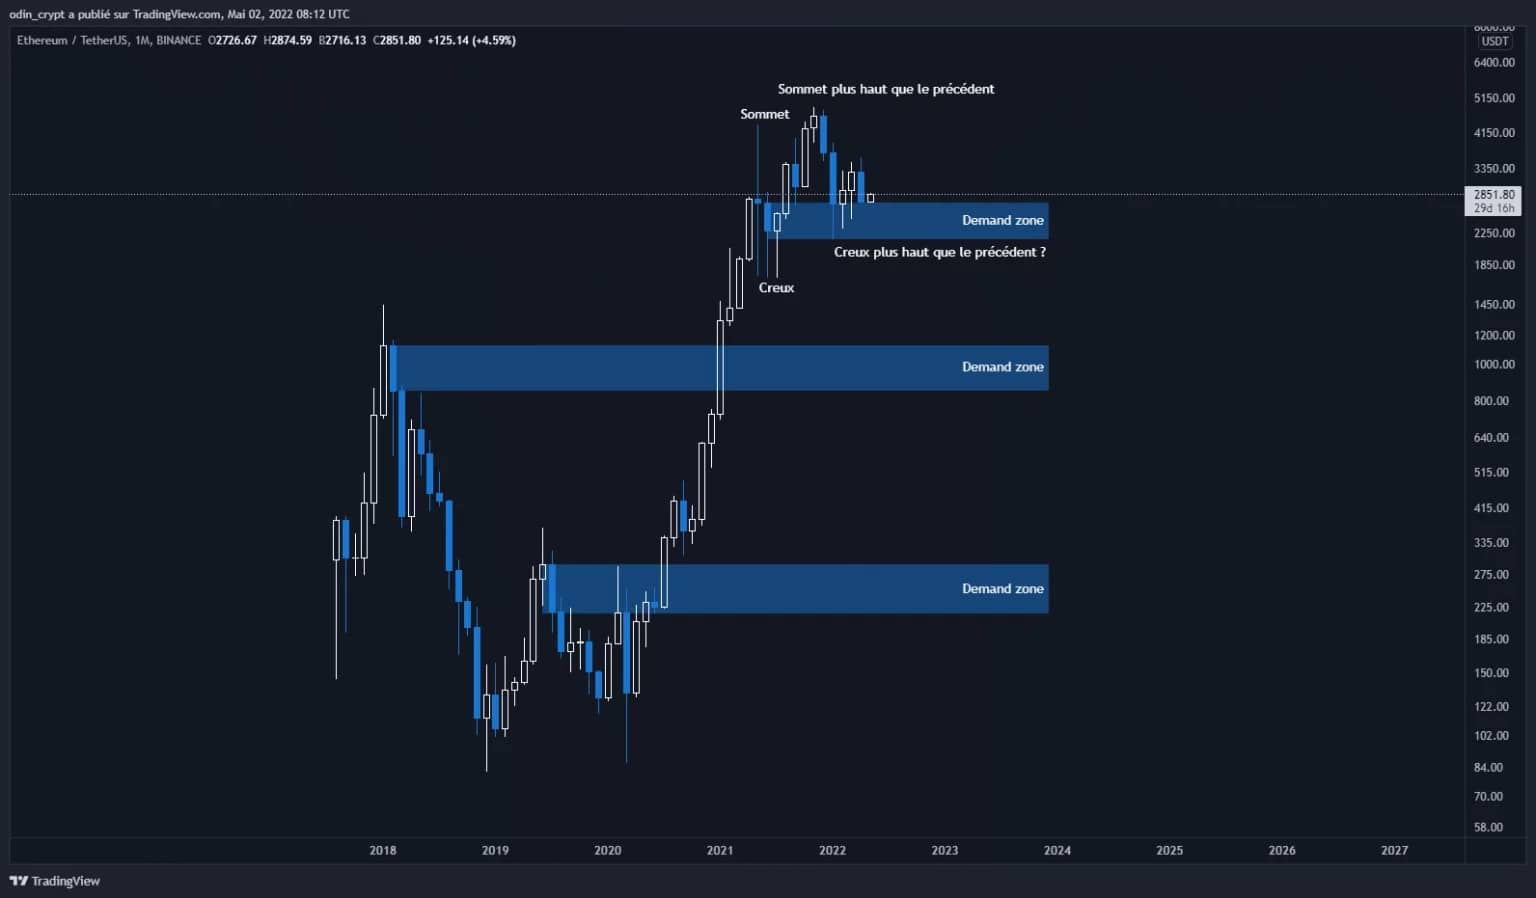
Our next analysis will focus on the price of Ether (ETH). As with Bitcoin, the price on the monthly view follows the same structure.
The lows and highs continue to be higher than the previous ones, and a downward break of the last low ($2,300) will create a much deeper retracement. The first identifiable area is not until $825 – $1,125.
Ether (ETH) analysis in 1M
On the weekly view, the price looks clearer than for Bitcoin. Indeed, we have seen a recovery from the last local high, a sign of a reversal. The price has logically retraced its bullish momentum to retest its demand zone at $2,450 – $2,775, where it currently sits.
This area therefore presents good opportunities in a bullish logic.
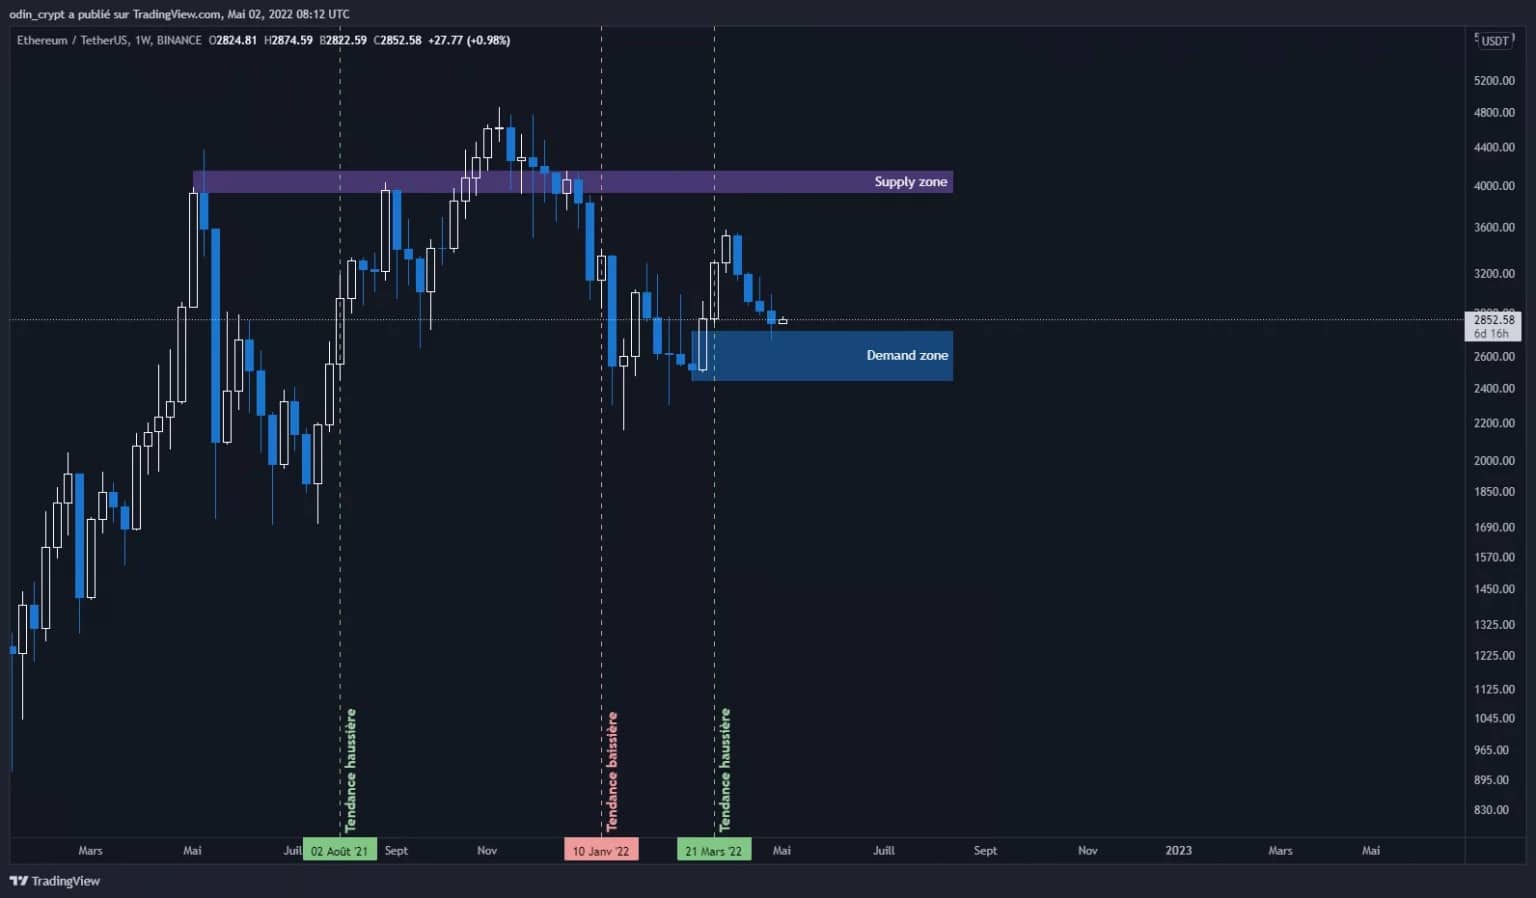
Ether (ETH) analysis in 1W
The daily view will confirm this local bullish assumption, with a higher and higher top and bottom pattern. To maintain this, price will need to maintain closes above $2500. To validate a full bullish recovery, price will need to break the $4,000 – $4,300 sell zone to the upside.
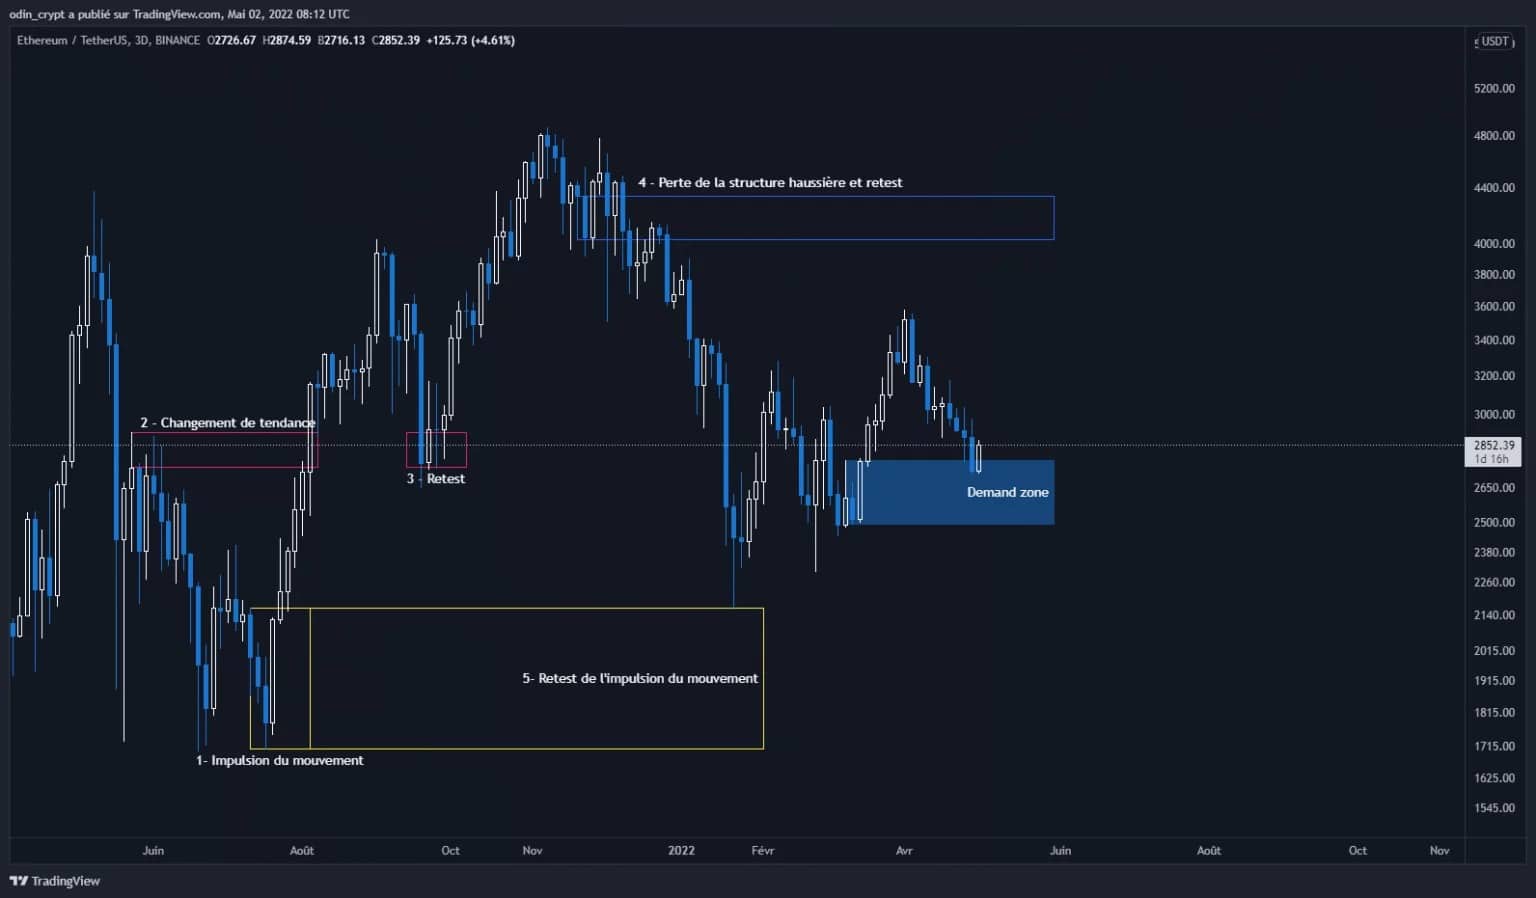
Ether (ETH) 3D analysis
Technical analysis of Decentraland (MANA)
This week I decided to analyze Decentraland and its token MANA. The latter has been much talked about, and the hype seems to be wearing off.
For its technical analysis, I will focus on its daily view. The Decentraland MANA price is retracing its bullish excesses with a +564% candle in 3 days. Price is purging this phase by revisiting the demand zones.
There are several zones that price will have to test, and it is currently on one of them. This will allow for more or less long term buy positions to be taken. Those who wish to strengthen their position should look to the $0.71 – $0.85 area. This will allow a longer term uptrend to resume in my opinion.
The $0.99 – $1.10 and $1.37 – $1.67 areas should only allow for short rebounds from the downward retracement.
Buying at these points without a solid strategy will be more of a gamble than building a long term position.
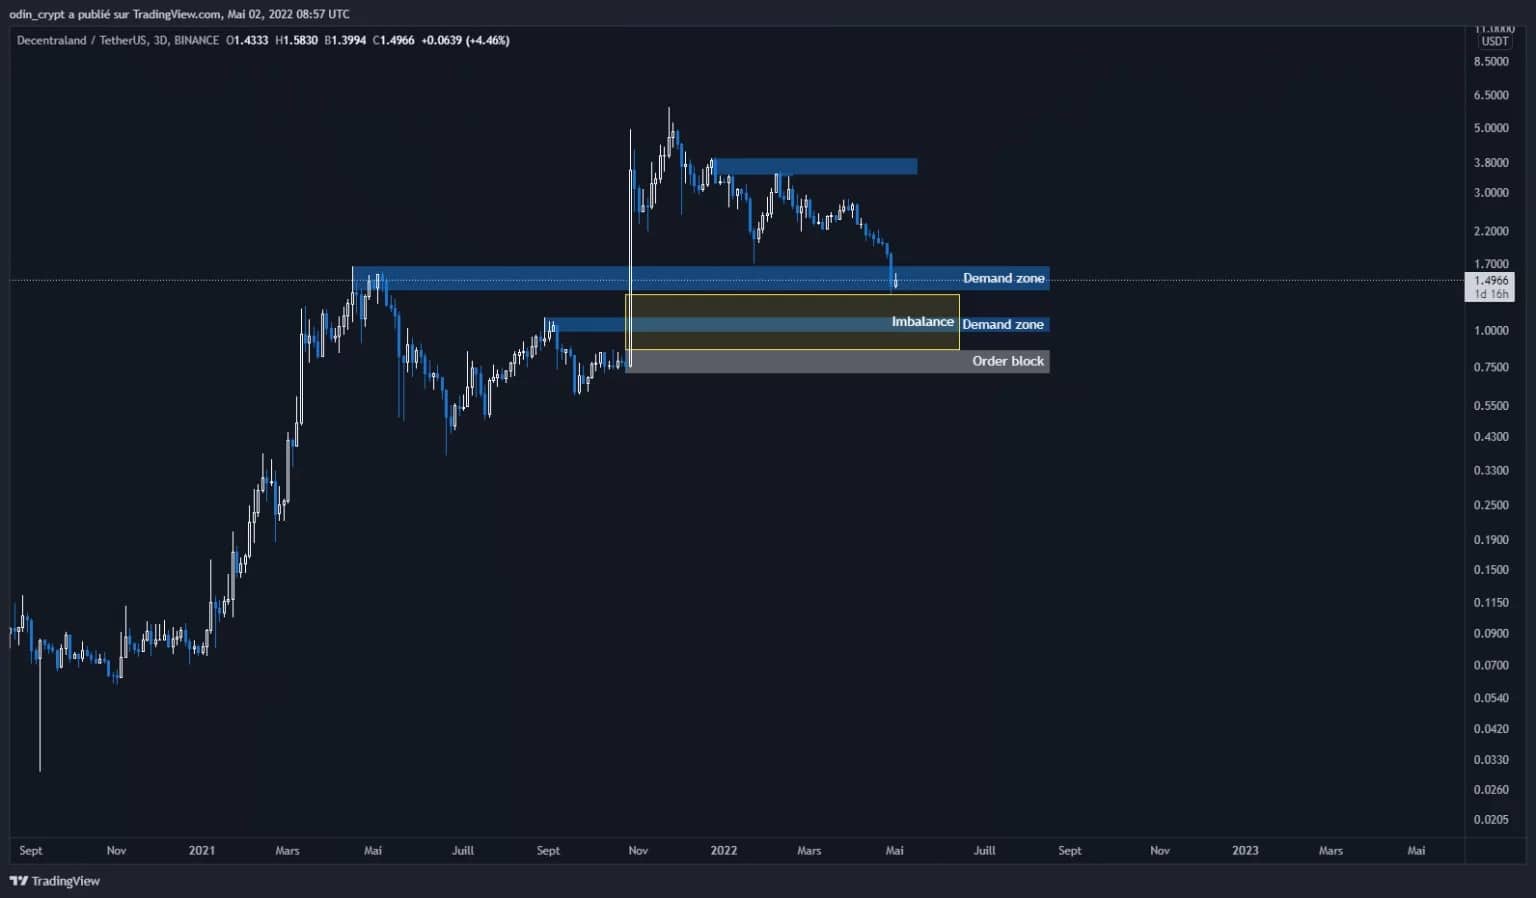
Decentraland (MANA) 3D analysis
Conclusion
Bitcoin (BTC) and Ether (ETH) prices are currently in buy zones that need to be defended. If these are lost, the scenario of a deeper market retracement opens up. However, the macro price still remains bullish. On shorter time units (daily), it is easy to identify a lateralisation phase that takes place on support zones.
For Decentraland (MANA), the price has started its long correction and more falls are expected. The $0.71 – $0.85 area will provide a very good entry point for a macro bullish move.
In general, the markets are in a turbulent lateralisation phase, where both buyers and sellers will be chased. The low volume and diminished momentum mean that we can expect strong moves in the coming weeks.
Limiting exposure while waiting for the return of the trend movements seems mandatory for less experienced players.