
Bitcoin is entering a bearish phase, driven by a macroeconomic environment that is less favorable to risky assets. Although an initial technical level that could trigger a rebound has been reached, the downtrend could continue all the way to the threshold that could call the monthly trend into question.
Revision of Monetary Policy Projections
On Tuesday, November 18, 2025, at 10:54 a.m., Bitcoin was trading around $91,100, following several days of sharp declines.
Many are wondering about current market dynamics, particularly the factors behind this decline.
It has not escaped anyone’s notice that this phase of price contraction is not limited to cryptocurrencies. All risky assets are affected, including gold—the quintessential safe-haven asset—which is also entering a consolidation phase.
The cancellation of macroeconomic data releases for October—a direct consequence of the lack of data collection during the government shutdown—is plunging both the markets and the central bank into uncertainty.
In this context, the rate cut—previously expected in December—now seems unlikely. These adjustments are also reflected in price movements.
The market now estimates a 45% probability of a rate cut in December, down from 90% at the beginning of November.
In the Bitcoin derivatives markets, compulsive buyers—who had calmed down as the price approached $100,000—have reignited the trend, driving the price down to $90,000.
It is still too early to tell whether last night’s dip below the $90,000 threshold was enough to dampen the enthusiasm of those desperately trying to catch a falling knife.
In fact, we are seeing a rise in financing fees while open interest is declining. This suggests the gradual closing of short positions—profit-taking that could fuel a technical rebound.
Bitcoin’s performance indicators are clearly negative against the dollar across all time frames. However, against Ether, Bitcoin is managing to hold its ground, demonstrating, as is often the case, greater resilience.
Weekly structural zone approaching
As we mentioned last week, trends are largely aligned to the downside, with the exception of the monthly chart and higher time frames, which remain favorable for Bitcoin’s continued rise.
A weekly close below the 50-week moving average is a significant signal that places the chart in a sustained bearish trend.
To invalidate this signal, the price must quickly return to the $103,000 level, ideally within the next two weeks.
For such a scenario to materialize, a shift must occur in the derivatives markets, which currently continue to favor a downtrend, in blatant denial of the ongoing bearish momentum.
However, the technical level we have just reached could serve as an ideal support zone for a rebound.
This zone is defined by the high and low points of the pattern formed between last March and April, prior to the bullish move that led to the all-time high of $125,000.
Here, around $88,000, Bitcoin could repeat the pattern seen in April 2025, when it found support at $74,000—the peak of the 2024 consolidation—before resuming its upward trend.
This hypothesis is supported by the formation of the quarterly uptrend, in which the price is moving between the Bollinger Bands—which are still widely open—and the 7-period moving average, which currently stands at around $88,000.
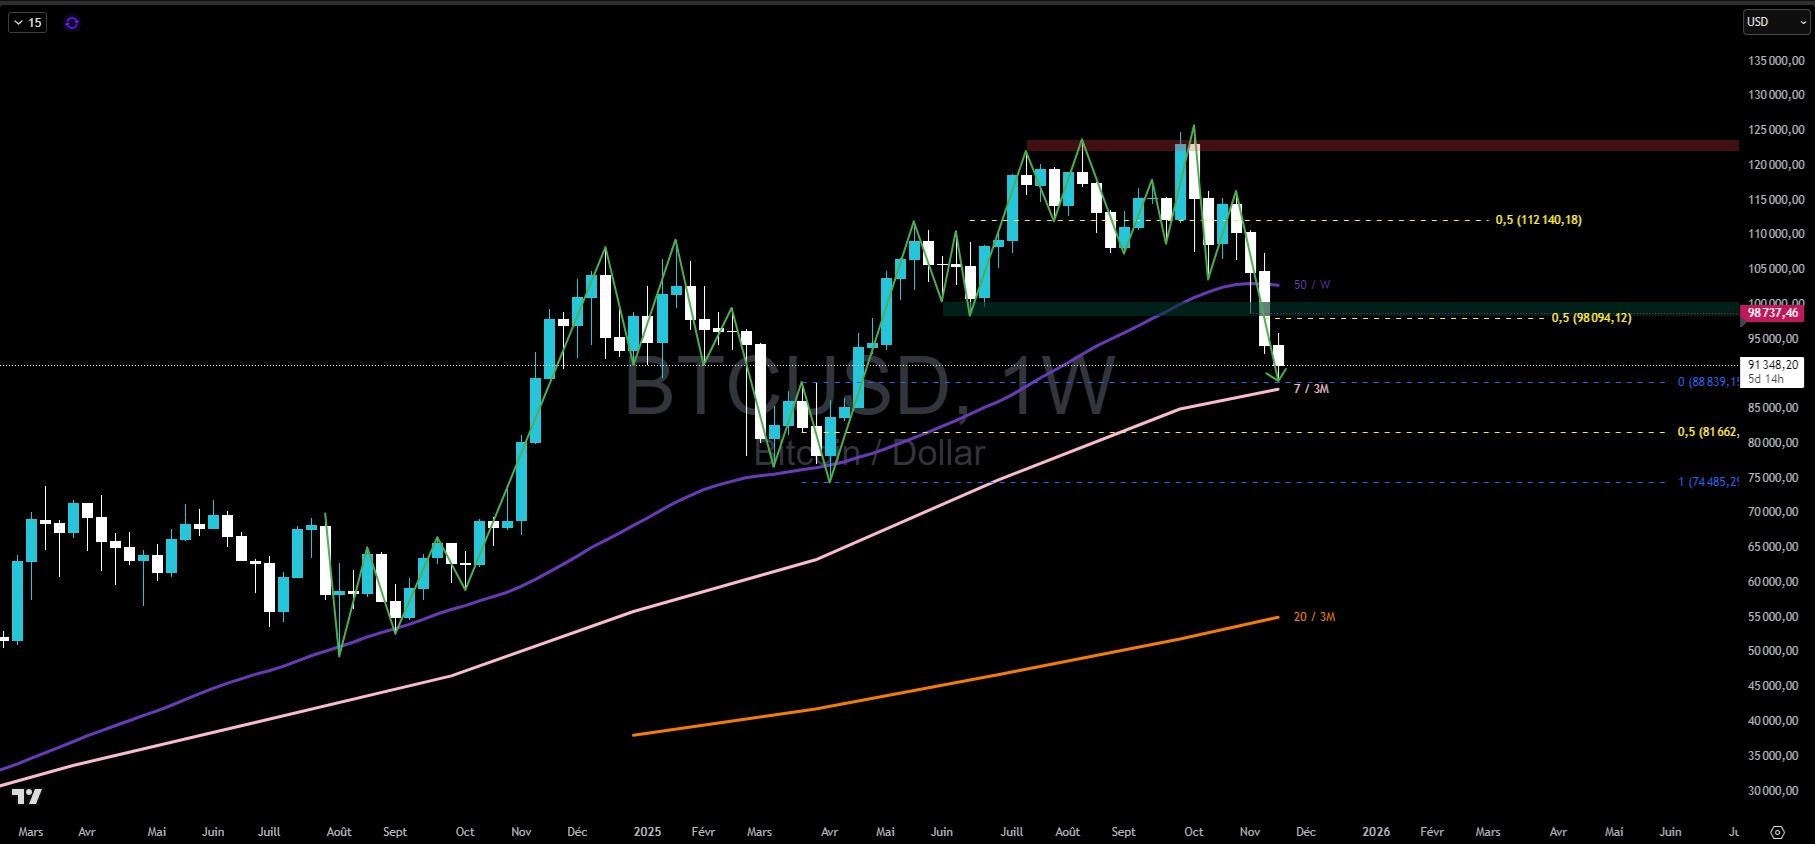
Bitcoin price chart on a weekly timeframe
Nevertheless, a continuation of the downtrend to break below this structure cannot be ruled out.
Indeed, the daily chart is firmly entrenched in a bearish trend that, to experience an initial slowdown, must be able to regain the $96,000 level.
If this downtrend were to continue, it could test the monthly trend line in conjunction with the low of the April 2025 consolidation, around $74,000.
In the meantime, it seems reasonable to assume that this correction will not be sustainably halted without, at the very least, a multi-day recovery of the upward momentum.
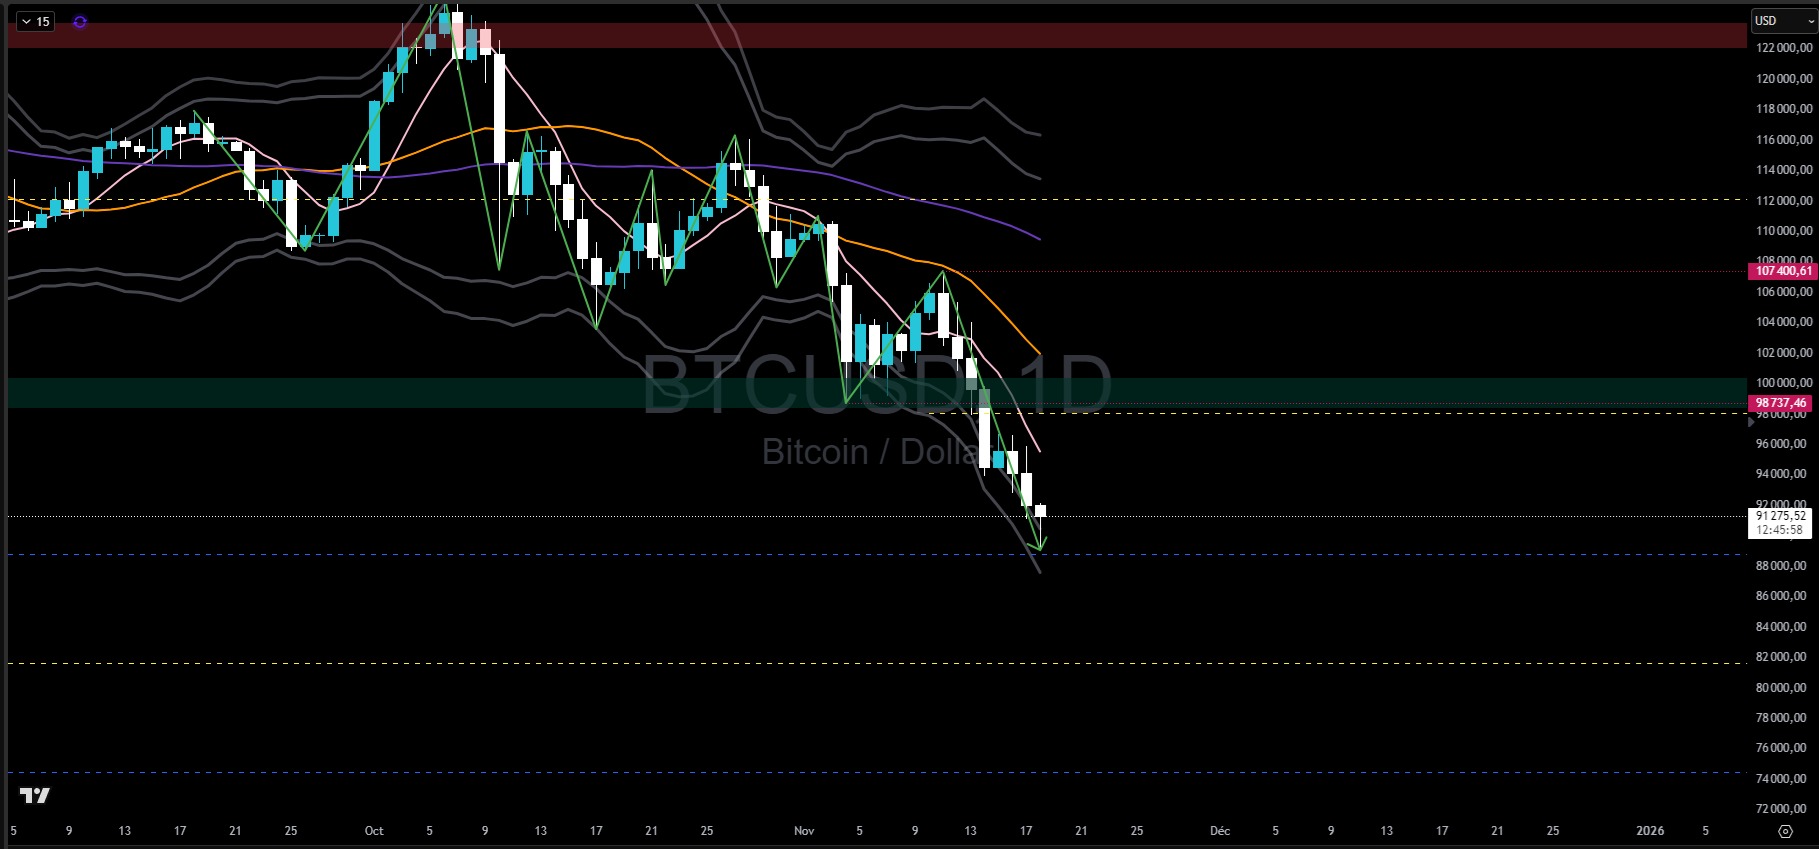
Bitcoin price chart on a daily timeframe
In summary, Bitcoin is trending downward, driven by the macroeconomic environment and a desperate search by buyers to find a bottom. This move could extend as far as $74,000, a level that must hold for the monthly trend to continue.
So, do you think BTC could reach $150,000? Feel free to share your thoughts in the comments.
Have a great day, and we’ll see you next week for a new Bitcoin analysis.