
Bitcoin price has been stalling below $30,000 resistance for the past week, after peaking at over 75% bullish recovery since the beginning of the year. The altcoin season is still a long way off with BTC still dominating the top of its range. Technically, what is the likelihood of a retracement sequence to the $25,000 medium term support
Is a retracement to $25,000 still a technical assumption?
Is the yearly upward movement of the Bitcoin price, boosted by the banking crisis in March, running out of steam at the $30,000 mark? In order to judge BTC’s underlying momentum, one must look at the weekly chart, the time frame that allows one to project over several weeks.
The bullish reversal has always had a well-constructed chart structure on this time scale, with phases of bullish impulses separated from each other by periods of sideways transitions.
At the source of the bullish reversal in the last quarter of 2022 and prior to the bullish reintegration of the $20,000 level (which gave the rebound its start), the price action had been preceded by a superb bullish momentum divergence (represented on the first chart below by the RSI technical indicator) from the oversold zone.
It was now the technical overbought zone that was joined by this indicator as the BTC price attacked the $30,000 resistance. The overall technical setup is similar to that of August 2020 which had a retracement period from $12,000 to $9,500 before the bull run from October 2020 onwards was initiated.
In terms of chartist probabilities, the scenario of a move back towards the major support of $25,000 has therefore become more likely. Thus, I consider that the preservation of this support represents the level of invalidation of the market rise in 2023. This scenario of a test of $25,000 before resuming an upward move would be triggered by a break of short-term support at $28,800, the upper part of the bearish gap opened on Monday 13 June 2022.
As I write this, the market is on the edge of a major long liquidation session.
There is only one way for the market to avoid a return to $25,000, and that is a firm bounce off $28,800 and overcoming the intermediate resistance at $29,500 to re-signal the bullish impulse.
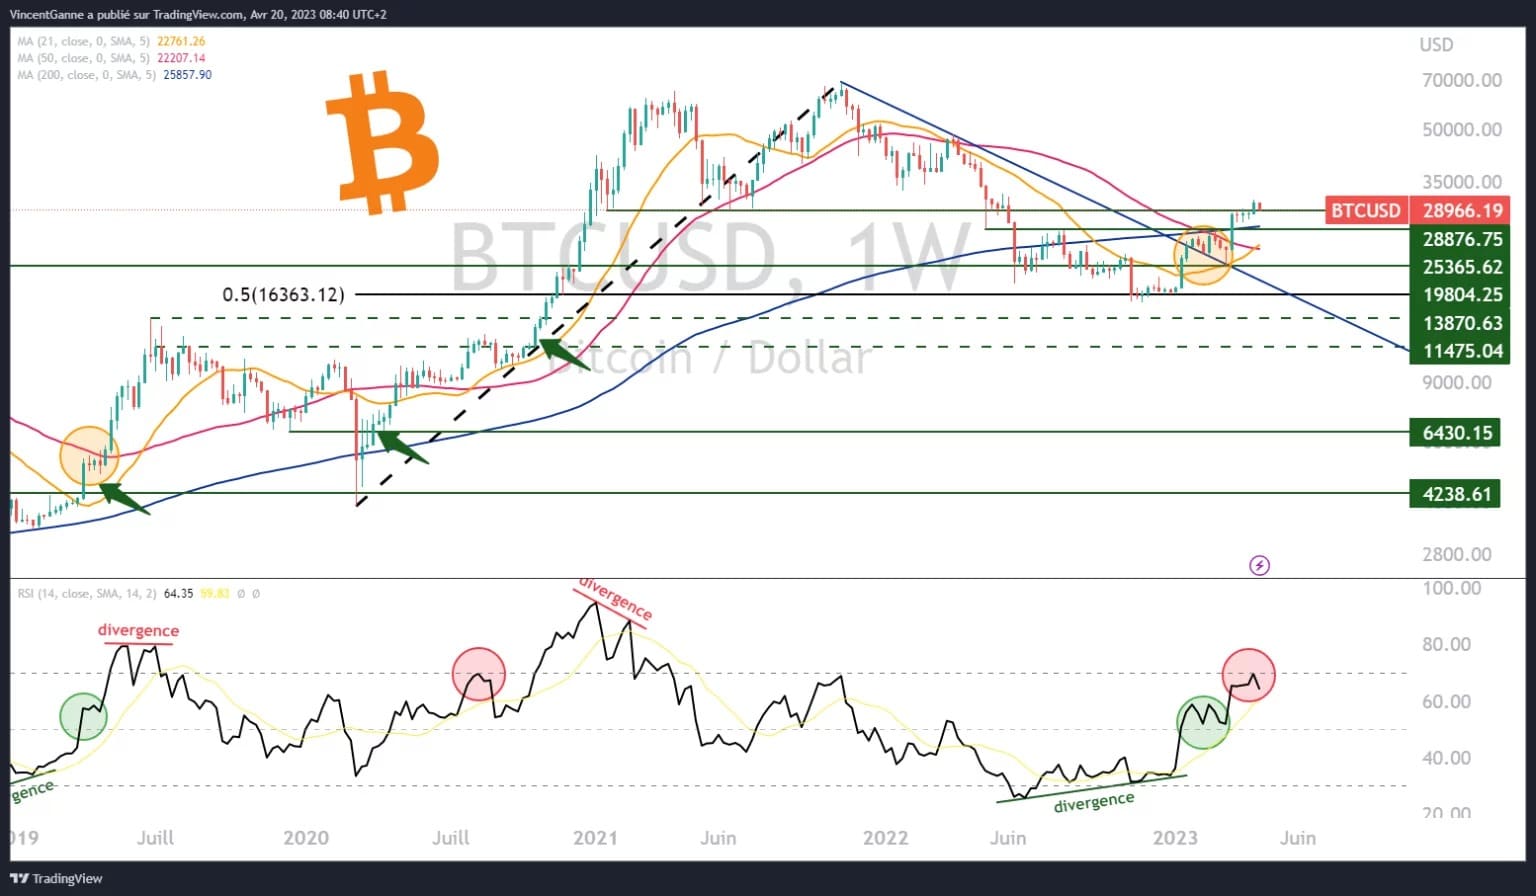
Chart that displays Japanese candlesticks in weekly bitcoin price data with logarithmic scale
The trend in rates and the US dollar will influence Bitcoin’s technical choice
Bitcoin is facing a chart alternative and the market will make its choice in the next few hours. This choice will probably be conditioned by inter-asset class influencing factors, in particular two data:
- The market interest rate trend;
- The behaviour of the US dollar in Forex, which has returned to its yearly low, acting as support.
To neutralize the scenario of BTC falling towards $25,000, the following combo is needed: break of support on the US dollar and end of the rate rebound period. Now let the market make its choice
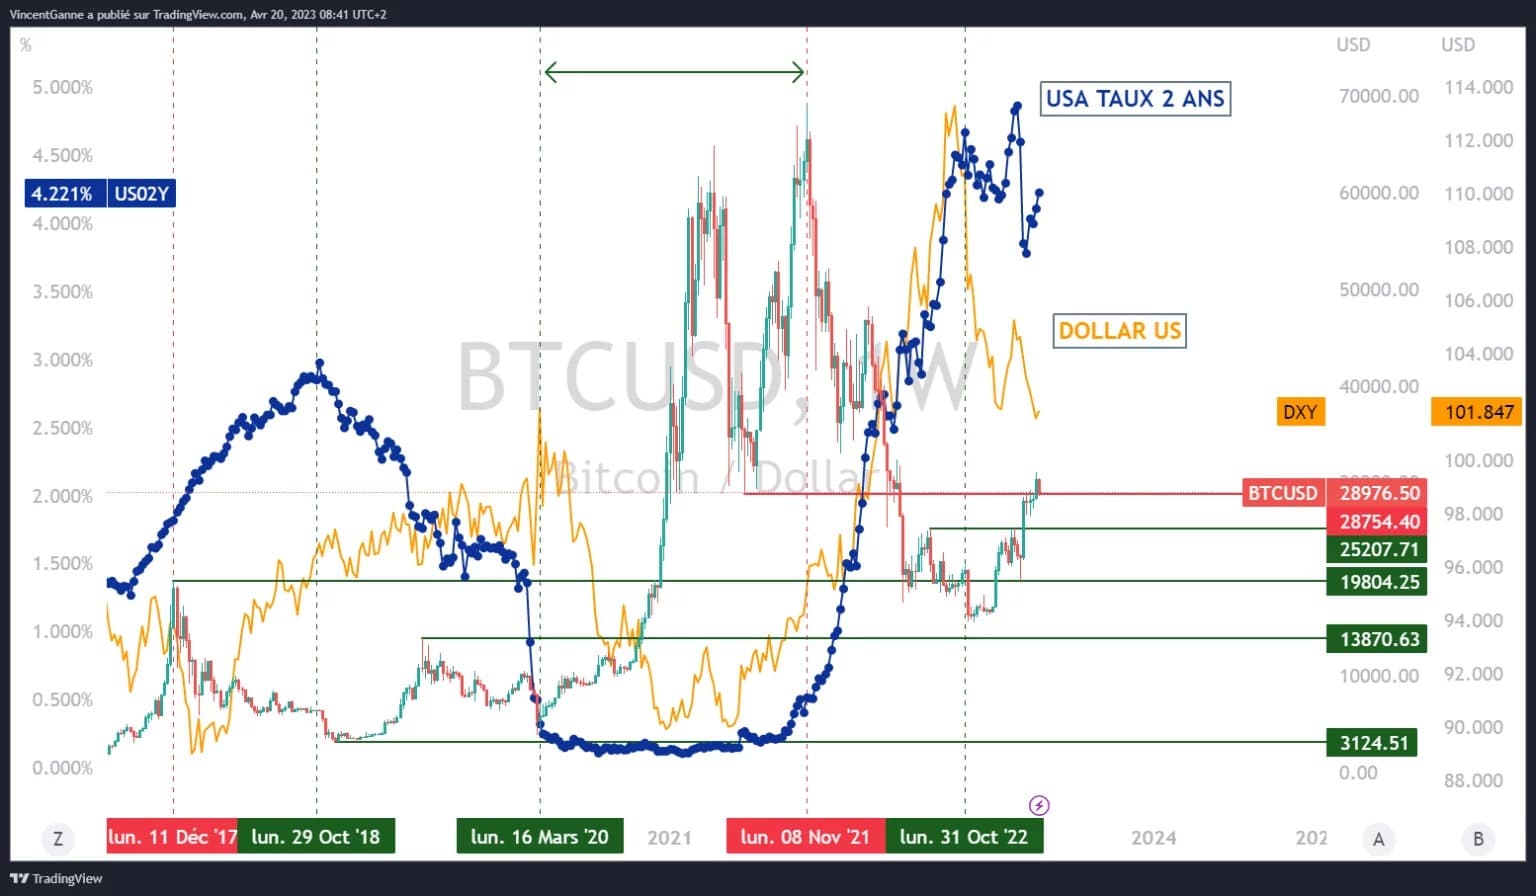
Chart that compares the weekly bitcoin price in arithmetic scale with the US 2-year interest rate and the US dollar curve on Forex
*** Translated with www.DeepL.com/Translator (free version) ***