
This week, Bitcoin (BTC) and Ether (ETH) failed to break through their resistance. Should we be worried about this new correction in crypto currencies?
Bitcoin tests support at $40,000
While the Bitcoin (BTC) price was showing reversal signals following the breakout of the daily descending wedge (3rd yellow pattern on the chart) and the Supertrend indicator turning green, the price is currently correcting around an important level, the $40,000 level.
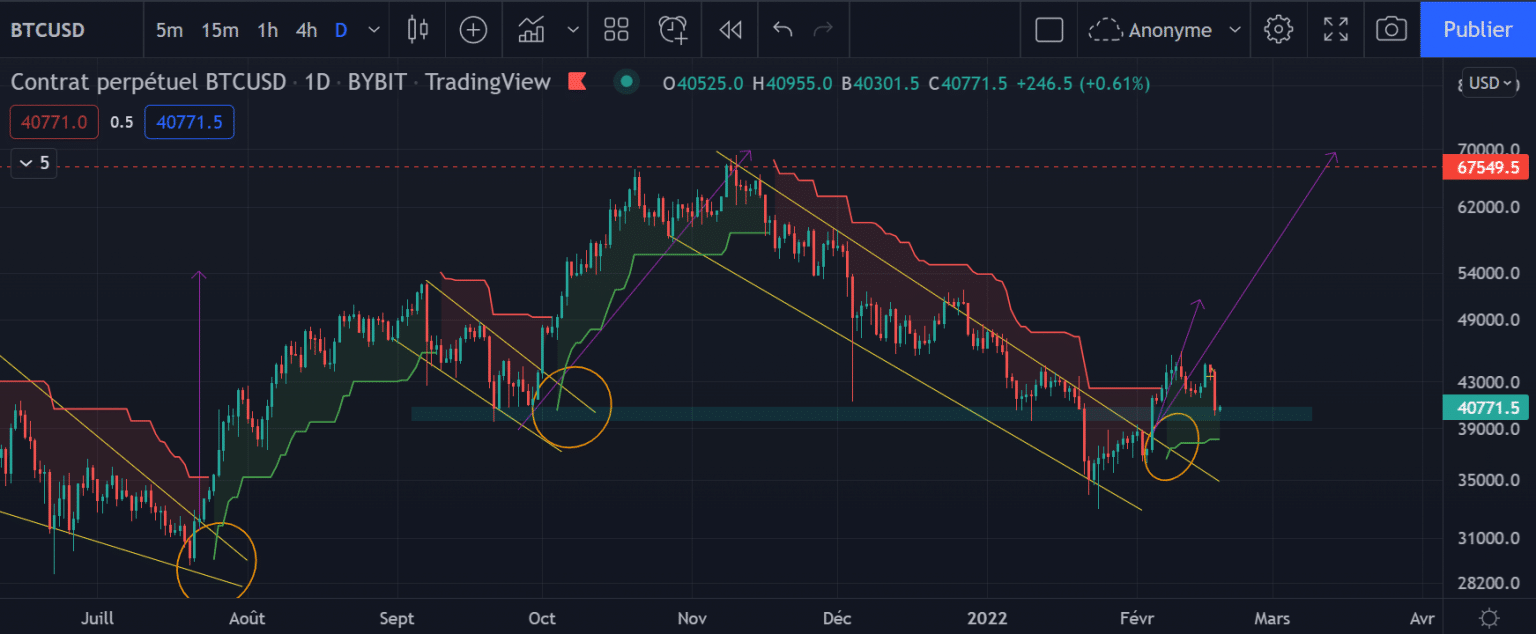
The Bitcoin Daily Chart
As we explained in last week’s analysis, after breaking its upper trendline, the descending wedge theoretically aims to reach its highest point, i.e. a return to $67,500 in the coming months. But to get there, it will first have to pass two important resistances: the one at $45,000, then the next at $50,000.
Obviously, the market will not go in a straight line towards its objective, but as long as the crucial $40,000 level remains in support, there is no reason to worry. Secondly, the new uptrend just given by the Supertrend indicator remains valid as long as the price does not fall back below $38,150 at the close.
As a reminder, every time the Supertrend has turned green in 2021 following the break of a Daily Chartist pattern, the price has only fallen back below its signal when the target was reached. Will we see the same scenario again this time?
Ether still under resistance
The price of Ether (ETH) has been in a broadening downward pattern for several months. While this type of chart pattern is generally a good way to anticipate a market reversal, it is important to make sure that the price breaks through the $3,200 resistance level.
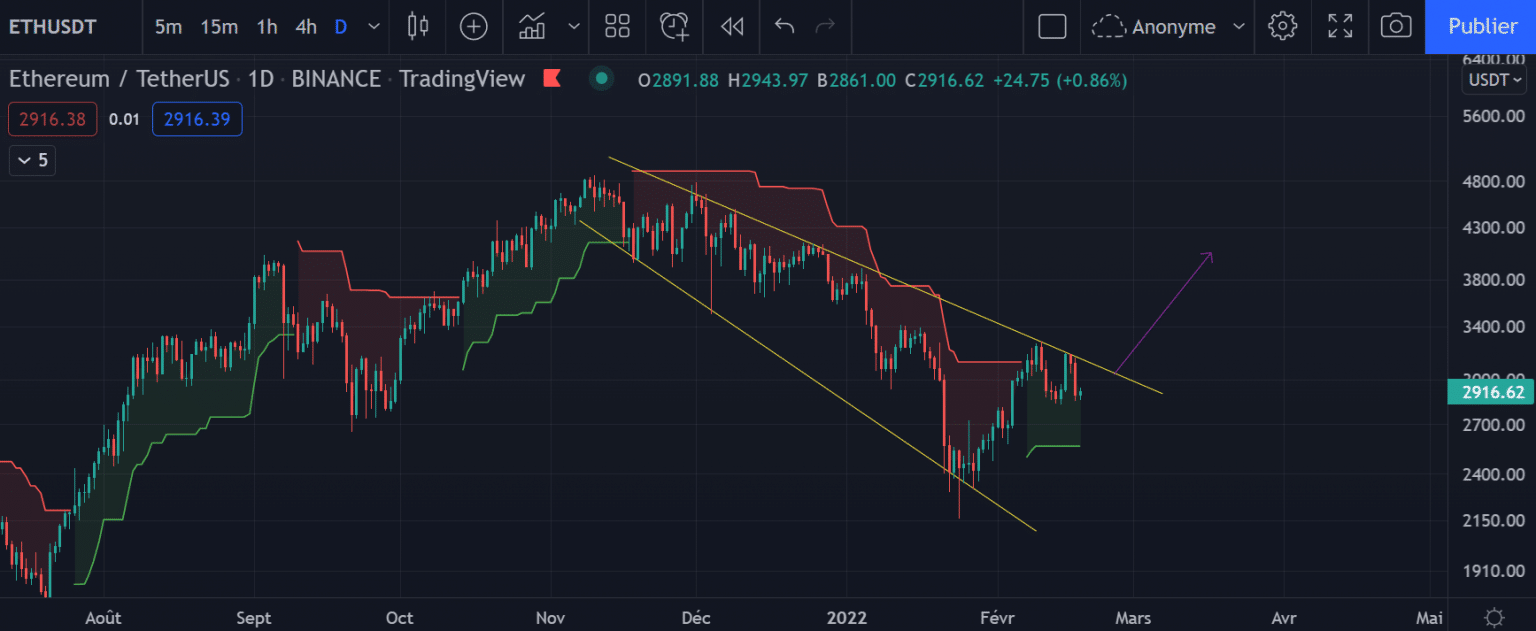
Ether (ETH) chart in H4
Indeed, as long as the price fails to break back above the trendline high, there is always a risk that Ether will continue its downward trend. Reassuringly, however, the Supertrend is signaling a bullish recovery, with a flat formed at $2,570, the support level that should not be broken. If the price breaks back below this level, the positive signal from the indicator will be invalidated.
If the price manages to break the pattern from above, it will trigger a bullish signal towards $3,970 (height of the wedge, reported at the breakout point).
In conclusion
Cryptocurrencies, facing significant resistance, now need to confirm their new support in order to bounce back better. As long as the price does not break below the Supertrend, the new uptrend and the previously stated targets remain valid.