
After a very bearish week for cryptocurrencies, Bitcoin (BTC) is trying to stabilize around $30,000 while Ether (ETH) is holding $2,000. What scenarios to watch for in the coming days
Bitcoin needs to get back into its range before the weekly close
After a very eventful week, the Bitcoin (BTC) price is now trying to move higher after rebounding from $26,700. Will BTC finally get back above $30,000 and return to its weekly closing range
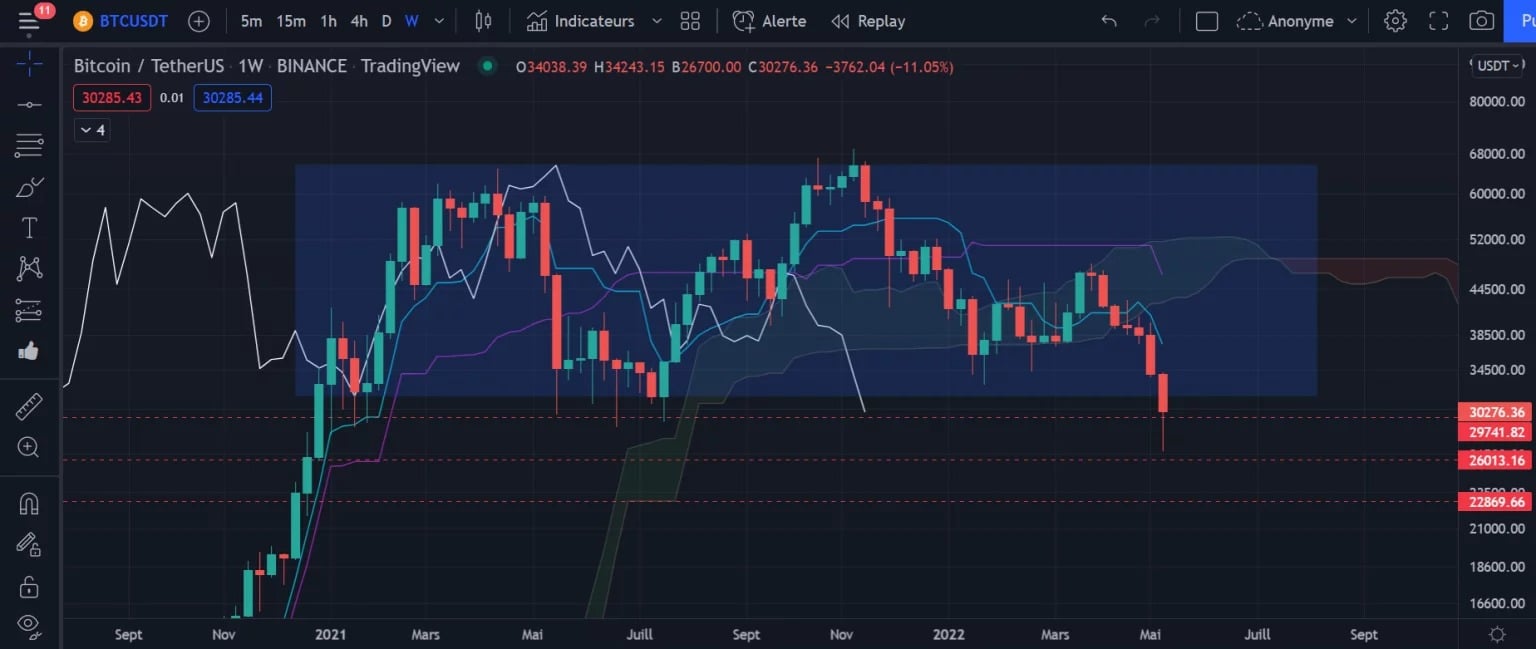
Figure 1: Bitcoin Weekly Price Chart
In our previous analysis, we pointed out that the Bitcoin price was still moving within its weekly range, and has been since the beginning of 2021. A range is a horizontal price movement, which can be framed in a rectangle. A range is said to be “broken” when the price breaks out of it during a close. If the price exits with a wick but closes with a re-entry, then the range is not considered broken and the possibility of a bounce to the middle or even the top of the range becomes highly likely.
During the last few bounces off the bottom of the $30,000 range, the price has always ended up back inside the rectangle at the weekly close. BTC then stabilised for several weeks, and then systematically moved back to the top of the range to make a new ATH. Despite a different and difficult economic context, with unpredictable events that precipitated the fall of cryptos, such as the collapse of the Terra project, this support could remain valid at the end of the week.
If there is a bounce off the support, we could then target the Tenkan towards $37,400, or even the Kijun towards $46,225. If the 30,000 gives way at the close, the next weekly support levels are at $26,000, then $22,800.
Bitcoin breaks a reversal pattern from the top at h1
While in a very strong downtrend since May 5, BTC has managed to break through its downward broadening pattern from above. The breakout suggests a possible return to $35,000.
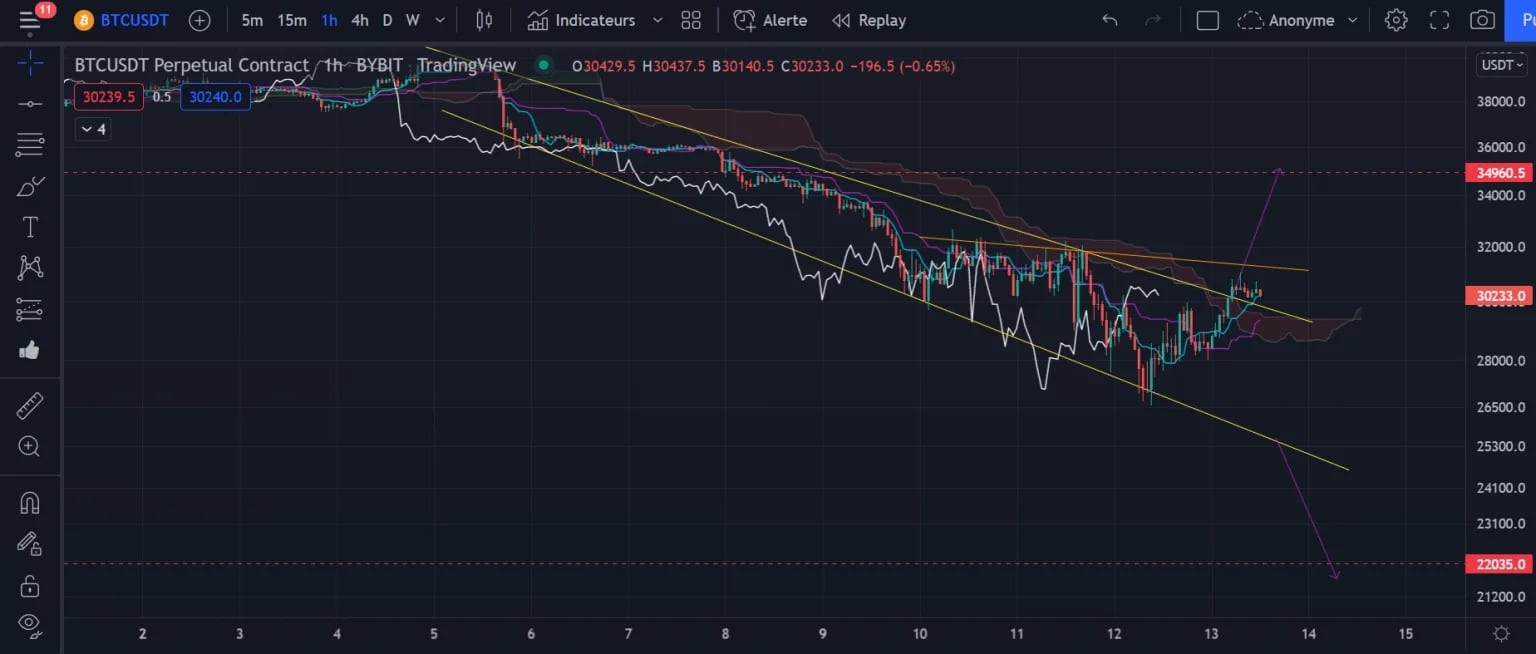
Figure 2: Bitcoin price chart (h1)
In theory, these types of chartist patterns most often break from the top, with a minimum target corresponding to the height of this one at its exit so at $35,000, then its maximum target can go up to the first contact point in the pattern here at $39,700. The price has thus broken a major bearish trendline, has risen back above its cloud and the Tenkan as well as the Kijun. These curves are now acting as supports which could help the price to move back towards $35,000.
Nevertheless, watch out for the Chikou Span which does not yet validate the bullish exit, as well as the small orange trendline which could reject the price. It will therefore be crucial to see in the coming hours if the price manages to hold its bullish breakout because in case of reintegration, there will unfortunately be a strong probability of going for the bottom of the pattern at $25,000. The bearish scenario would be for this pattern to then give way at the bottom, towards $22,000.
Ether (ETH) needs to hold the $2,000
While it too is in a descending broadening wedge, Ether (ETH) will need to hold its support at $2,000 and then break its trendline from above.
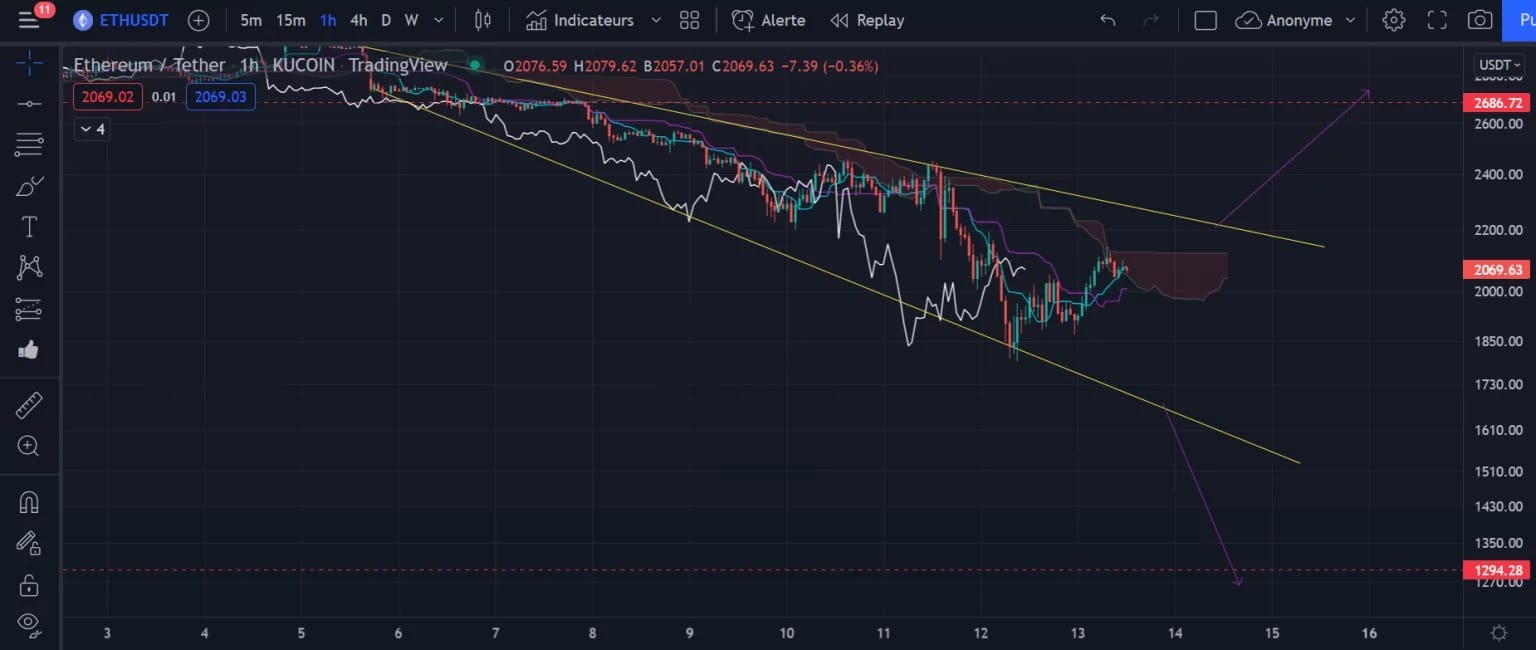
Figure 3: Ether (h1) price chart
If it manages to break its pattern from the top, the ETH price could move back towards $2,686. For now, as long as the price stays below the cloud, it seems complicated though. It will be necessary to break the cloud on the upside because with a bearish rejection, the next support will be at $1,600, a risk of breaking the wedge from below will follow with a target at $1,294.
In conclusion
Cryptocurrencies continue their decline after a tough week. It will be necessary to close inside the weekly range of BTC on Sunday to try to start again with a rebound.